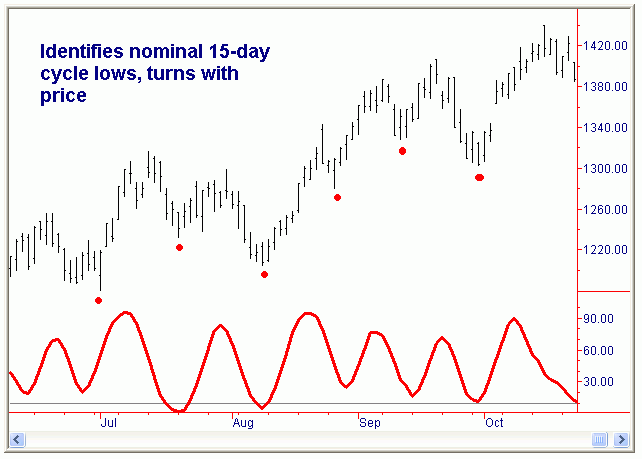
The Dominant Short-Cycle Indicator is excellent for tracking a regular occurring cycle of between 10 and 20 bars in length. In fact, its the one I use in my nightly outlooks to track the 15-day cycle. I also use it on the hourly chart to ferret out a dominant 10-20 hour short-term cycle there as well. I like this indicator because it is fairly smooth, but yet also turns quickly after cycle bottoms or tops - about as much as you could ask for in such an indicator. Also, this indicator works about as well for the hourly chart as it does for the daily chart.
The chart below is a four-month period on the Nasdaq 100 index (NDX). Note that the indicator turns very quickly with the nominal 15-day cycle, catching lows just after price turned in most cases. The 15 and 30 day nominal cycles are the most dominant trading cycles for the short-term trader, and thus present the best opportunity to make the most amount of money in the shortest amount of time.

If the trend of the market is strongly UP (as it was throughout much of the chart above), then the oscillator will usually turn before price at cycle tops. This is not a 100% rule, but it occurs more often than not. In other words, if the market is in a strong uptrend, then it does not pay to try and short the market just because the indicator is turning down -that it UNLESS a solid divergence is forming between the oscillator and price.
Divergences
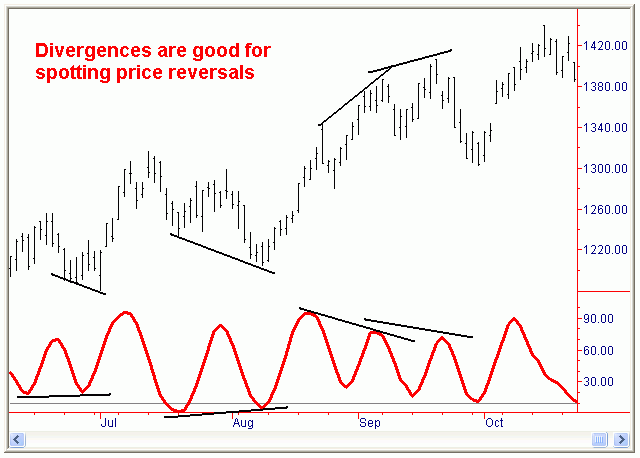
It's also good when divergences form between the indicator and price.
Below is the same chart as before, only this time key divergences are noted
between price and the oscillator. Note that, in nearly each case an immediate
reversal occurred in the opposite direction. This makes it key to note:
when price is making lower lows or highs, but the oscillator is not confirming
- then be on the alert for a price reversal to occur soon.
The divergence in the third week of September was a ‘double divergence’. In other words, a first divergence formed in early September, and then another lower peak with the oscillator was seen in the third week of September as price continued to climb. The double divergences are rare - and will many times usher in the strongest reversals with price.

Using the indicators as a ‘breakout’ strategy
A very nice way to use the cycle indicators is for playing breakouts.
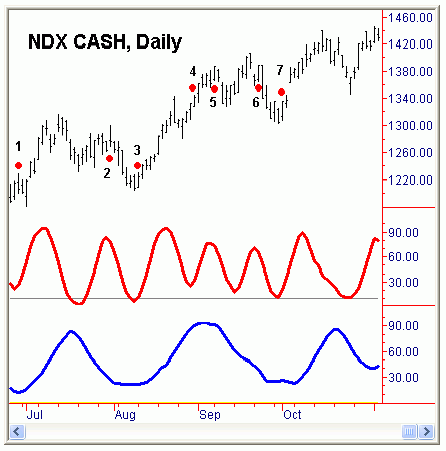
To do this you really need both the short (red) and mid-cycle (blue)
indicators. The mid-cycle indicator measures a 20-30 bar cycle.

Chart above illustrates some examples of how both the short and mid-cycle indicators can be used together to play breakouts. Point 1 on this particular chart shows the point at which both the red 15-day oscillator and the blue 30-day oscillator turn up simultaneously (in other words, they are both moving to the upside at the same time). Note the high of that bar - which becomes the ‘breakout’ bar/point. The high of that bar was 1229 NDX CASH. The actual breakout did not come for another 3 trading sessions. When it did come, the NDX really did not look back - and proceeded to rally to a high of 1319 in the coming sessions, a 90-point gain! Point 2 on the chart was the point at which both oscillators were both on the downside together. The low of that bar was 1269. That low was taken out the following session, and the NDX dropped another 65 points to a low of 1204 in the coming days. Point 3 was when both oscillators were simultaneously up; from the high of 1230 NDX CASH the NDX proceeded to rally to a high of 1342 over the following two weeks - a 112 point gain! Point 4 was another point at which both were up together; the NDX rallied from 1344 to 1387 on that upside breakout. Point 5 the blue had turned down and the red had also just flipped lower. The low of that bar was 1365. The NDX dropped to a low of 1327 in the coming sessions before bottoming. Point 6 was another downside turn in both oscillators, the NDX fell from the breakout bar low of 1364 to a low of 1303 in the coming days. The last point on the chart - point 7 - was the point at which both oscillators were both simultaneously on the upside. From the breakout bar high of 1336 the NDX rallied to a high on 1439 in the coming days - or another 113 points!
I should add here that, even with the above, all breakouts are obviously not going to work - so it is important to use stops at all times. A stop can be placed under the ‘breakout bar’ low - or just under the prior swing low - or traders can simply use whatever risk level they might feel comfortable with as a stop. I will leave that up to the individual. Either way, I think these indicators will be a valuable new trading tool to add to your arsenal.
To order, click HERE
Jim Curry